 تويت
 Reading Driver Behaviour Without Turning Into a Policeman
Harsh braking, hard cornering, rapid acceleration, speeding, and long idling all show up in a three-axis accelerometer and the speed signal. A threshold near 0.4 g for braking events and a speed profile per road type produce a weekly score for each driver. The score becomes a coaching tool when a manager sits down with the bottom five and the top five in the same week and asks what the routes and schedules look like from the cab.
Insurers in the region increasingly respond to documented improvement, and fuel bills drop when idling falls. Picture a fleet of 60 pickups that trims idle time by 25 minutes per vehicle per day. That saves about 1.5 litres per vehicle daily, close to 30,000 litres a year. (Hypothetical arithmetic: 60 vehicles × 1.5 L × 330 days ≈ 29,700 L; no documented data stands behind it.)
Dispatch Decisions Made on Live Positions
A customer calls at 14:10 and needs a technician in Ahmadi by 15:00. The dispatcher opens the map, filters for available vans within 20 km, sees that one is ten minutes from finishing a job nearby, and assigns it. Estimated arrival times update with traffic, and the customer receives a tracking link by SMS. Ringing around six drivers would have taken longer than the whole assignment.
Delivery fleets gain the same advantage in route sequencing. Fleet management system international FMSI provider Stops get ordered by drive time, time windows are respected, and proof of delivery carries a timestamp and position. Across a typical day, the dispatcher’s attention shifts from asking where everyone is to deciding who should go next.
Crossing Borders and Keeping the Signal
A trailer leaving Shuwaikh for Dammam passes through Kuwaiti and Saudi networks, then waits at a customs post for an unpredictable stretch. Tracking units with multi-IMSI or eSIM profiles move between carriers on their own, so the vehicle stays visible across the GCC without a SIM swap at the border. The platform logs entry and exit through geofences, and dwell time at each post becomes a number you can compare month by month and raise with your clearing agent.
Imagine a fleet that averages 5 hours at a crossing and trims it to 3.5 hours through better document preparation. That returns 1.5 hours on every trip, and across 400 trips a year it adds up to 600 truck hours. (Illustrative hypothetical figures.)
Fuel Control Beyond the Tank Gauge
Pairing GPS data with fuel card transactions exposes patterns that a monthly statement hides: a fill-up of 90 litres into a tank rated for 70, or two fills within an hour at stations 30 km apart. Level sensors in the tank, or fuel flow data read from the CAN bus on newer trucks, supply a second record. Siphoning shows as a sudden drop while the vehicle is parked, and every station stop is timestamped and positioned. Monthly reports rank vehicles by litres per 100 km against their own history, which treats a ten-year-old pickup and a new one fairly. (Illustrative examples.)
Maintenance Follows the Odometer
Service reminders keyed to real mileage and engine hours are easier to act on than a spreadsheet. The platform reads odometer data from the CAN bus or OBD-II port, schedules oil changes, tyre rotation, and brake inspection, and tracks expiry dates for registration, insurance, and driver licences so renewals stop arriving as surprises. Diagnostic trouble codes reach the workshop with the vehicle’s position. The light on truck 14 turns out to come from a coolant sensor fault, so a spare sensor rides in the van with the technician.
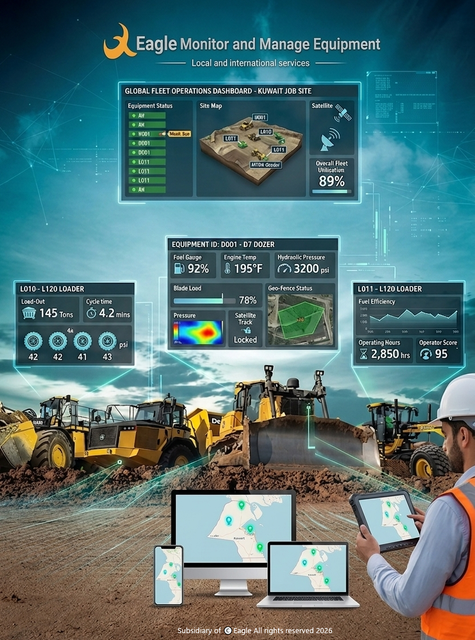
Heavy equipment with J1939 or Modbus interfaces adds hours, load, and coolant temperature to the same screen. Fewer roadside breakdowns mean fewer towing bills, and planned work migrates to quieter days.
Sector Snapshots From the Field
Construction contractors follow loaders, excavators, and water tankers by engine hours, so idle machines go back to the rental yard early and fuel gets issued against real working time. Oil service companies in the northern fields monitor pickups and crew buses against speed limits and approved routes, with a panic button wired to the control room. Courier and last-mile businesses watch drop density and failed deliveries by district.
Staff transport and school bus operators send parents arrival alerts and keep stop times on record. Municipal and waste fleets verify bin collection routes. Car rental companies use geofences to flag vehicles leaving the country without authorisation and rely on odometer data for accurate billing. Each sector asks for a different set of reports, and the platform builds them all from the same stream of data.
Insurers in the region increasingly respond to documented improvement, and fuel bills drop when idling falls. Picture a fleet of 60 pickups that trims idle time by 25 minutes per vehicle per day. That saves about 1.5 litres per vehicle daily, close to 30,000 litres a year. (Hypothetical arithmetic: 60 vehicles × 1.5 L × 330 days ≈ 29,700 L; no documented data stands behind it.)
Dispatch Decisions Made on Live Positions
A customer calls at 14:10 and needs a technician in Ahmadi by 15:00. The dispatcher opens the map, filters for available vans within 20 km, sees that one is ten minutes from finishing a job nearby, and assigns it. Estimated arrival times update with traffic, and the customer receives a tracking link by SMS. Ringing around six drivers would have taken longer than the whole assignment.
Delivery fleets gain the same advantage in route sequencing. Fleet management system international FMSI provider Stops get ordered by drive time, time windows are respected, and proof of delivery carries a timestamp and position. Across a typical day, the dispatcher’s attention shifts from asking where everyone is to deciding who should go next.
Crossing Borders and Keeping the Signal
A trailer leaving Shuwaikh for Dammam passes through Kuwaiti and Saudi networks, then waits at a customs post for an unpredictable stretch. Tracking units with multi-IMSI or eSIM profiles move between carriers on their own, so the vehicle stays visible across the GCC without a SIM swap at the border. The platform logs entry and exit through geofences, and dwell time at each post becomes a number you can compare month by month and raise with your clearing agent.
Imagine a fleet that averages 5 hours at a crossing and trims it to 3.5 hours through better document preparation. That returns 1.5 hours on every trip, and across 400 trips a year it adds up to 600 truck hours. (Illustrative hypothetical figures.)
Fuel Control Beyond the Tank Gauge
Pairing GPS data with fuel card transactions exposes patterns that a monthly statement hides: a fill-up of 90 litres into a tank rated for 70, or two fills within an hour at stations 30 km apart. Level sensors in the tank, or fuel flow data read from the CAN bus on newer trucks, supply a second record. Siphoning shows as a sudden drop while the vehicle is parked, and every station stop is timestamped and positioned. Monthly reports rank vehicles by litres per 100 km against their own history, which treats a ten-year-old pickup and a new one fairly. (Illustrative examples.)
Maintenance Follows the Odometer
Service reminders keyed to real mileage and engine hours are easier to act on than a spreadsheet. The platform reads odometer data from the CAN bus or OBD-II port, schedules oil changes, tyre rotation, and brake inspection, and tracks expiry dates for registration, insurance, and driver licences so renewals stop arriving as surprises. Diagnostic trouble codes reach the workshop with the vehicle’s position. The light on truck 14 turns out to come from a coolant sensor fault, so a spare sensor rides in the van with the technician.
Heavy equipment with J1939 or Modbus interfaces adds hours, load, and coolant temperature to the same screen. Fewer roadside breakdowns mean fewer towing bills, and planned work migrates to quieter days.
Sector Snapshots From the Field
Construction contractors follow loaders, excavators, and water tankers by engine hours, so idle machines go back to the rental yard early and fuel gets issued against real working time. Oil service companies in the northern fields monitor pickups and crew buses against speed limits and approved routes, with a panic button wired to the control room. Courier and last-mile businesses watch drop density and failed deliveries by district.
Staff transport and school bus operators send parents arrival alerts and keep stop times on record. Municipal and waste fleets verify bin collection routes. Car rental companies use geofences to flag vehicles leaving the country without authorisation and rely on odometer data for accurate billing. Each sector asks for a different set of reports, and the platform builds them all from the same stream of data.